

ABC Analysis
ABC analysis is an inventory prioritization method that sorts every item into three classes — A (high value or importance), B (moderate), and C (low) — so time and controls go where they matter most. Typically the top ~20% of SKUs (class A) account for around 80% of total inventory value.
How ABC analysis works
ABC analysis sorts inventory into three tiers by value and importance. A items are typically the top 20% of SKUs by annual dollar usage — roughly 80% of total inventory value packed into a fifth of the catalog. B items are the next tier, moderate in both count and value. C items are the largest group by count but the smallest slice of value, and usually need the lightest controls. The split is a rule of thumb, not a fixed law — a catalog with a handful of dominant products can be even more top-heavy than 80/20.
How to use ABC analysis
The classification drives how often each tier gets attention: A items are typically counted and reviewed monthly, B items quarterly, and C items annually. The same tiers can also set reorder point review frequency, purchase approval requirements, and how tightly a location is controlled — an A item might need a manager’s sign-off to adjust, where a C item doesn’t.
Classifying by more than revenue
Revenue alone can misclassify a critical item. A $4 bolt that stops an entire production line if it runs out deserves A-tier attention even though its dollar value looks like a C item — classification should factor in operational risk, not just sales dollars.
Worked example: ABC analysis on 500 SKUs
A distributor stocks 500 SKUs worth $975,000 in combined annual dollar usage. Ranking every SKU from highest to lowest annual usage value, the top 100 SKUs — 20% of the catalog — account for $780,000 of that total, exactly 80%. Those 100 become A items and get counted monthly.
The next 150 SKUs (30% of the catalog) add up to $146,250, about 15% of total value, and become B items, counted quarterly. The remaining 250 SKUs (50% of the catalog) account for just $48,750, roughly 5% of value, and become C items, counted once a year. The distributor now spends most of its counting hours on the 20% of SKUs that represent 80% of what’s actually at stake.
Common mistakes with ABC analysis
ABC classification tends to go wrong in the same few ways:
• Classifying purely by revenue and ignoring operational risk — a low-cost part that halts production deserves A-tier treatment regardless of its dollar value.
• Running the classification once and never rerunning it, even as new products launch and old ones decline — an item’s tier should move with its actual usage.
• Applying the same count frequency to every tier "to be safe," which erases the entire point of the exercise: spending less effort on C items.
• Classifying using only sales history, without accounting for lead time or supply risk — a slow-moving item from an unreliable single-source supplier can still warrant closer attention.
How ABC analysis works in StockZip
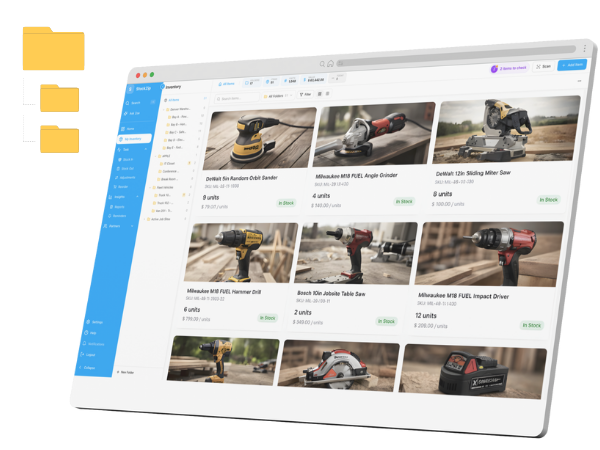
StockZip doesn’t run ABC classification automatically, but the pieces are there to build one: item-level tags or custom fields can hold an A/B/C label, and the stock count task can be filtered to that tag so A items get counted on a tighter schedule than C items, without a separate workflow for each tier.
Frequently asked questions
What is ABC analysis?
ABC analysis is a method for grouping inventory by importance so teams focus effort where it has the most impact.
What are A items?
A items are the highest-priority inventory items based on value, movement, risk, or operational importance — typically the top 20% of SKUs, representing about 80% of total inventory value.
How often should A items be counted?
Many teams count A items monthly, B items quarterly, and C items annually, adjusting for risk and transaction volume.
What percentage of items are usually A items?
Around 20% of SKUs, though the exact split depends on how concentrated the business’s sales or usage actually is — some catalogs are more top-heavy than others.
How often should B and C items be counted?
B items are commonly counted quarterly and C items annually, though C items with a high stockout cost may still warrant more frequent checks.
Can StockZip help with ABC analysis?
StockZip helps teams track quantities, movements, low-stock alerts, and cycle counts for prioritized items.