

ABC analysis: rank your inventory by what actually matters
ABC analysis splits your inventory into three classes by consumption value — the 20% of items that drive 80% of value (A), the middle (B), and the long tail (C) — so you count, reorder, and protect each class differently.
What is ABC analysis?
ABC analysis is a method of categorizing inventory into three classes by value and importance: A items are the roughly 20% of SKUs that account for about 80% of total inventory value, B items are the moderate middle, and C items are the low-value long tail. Each class is then counted, reordered, and controlled differently, so effort follows the stock that actually matters.
It is inventory’s application of the Pareto principle — the 80/20 rule — the observation that a small share of causes drives most of the effect. In a stockroom that means a handful of high-value SKUs tie up most of your working capital and carry most of your stockout risk, while a large tail of cheap parts barely moves the needle no matter how carefully you watch it.
The reason ABC analysis exists is simple: no team has the time to give every SKU equal attention. A business with 500 or 5,000 line items cannot count, review, and hand-manage all of them on the same schedule. Classification lets you concentrate tight controls, frequent counts, and careful reordering on the items where a mistake is expensive, and deliberately spend less on the ones where it is not.
The 80/20 rule and the three tiers
ABC analysis sorts inventory into three tiers by value and importance. A items are typically the top 20% of SKUs by annual dollar usage — roughly 80% of total inventory value packed into a fifth of the catalog. B items are the next tier, moderate in both count and value. C items are the largest group by count but the smallest slice of value, and usually need the lightest controls. The split is a rule of thumb, not a fixed law — a catalog with a handful of dominant products can be even more top-heavy than 80/20.
A common starting split is: A items are about 10–20% of SKUs and 70–80% of value; B items are about 30% of SKUs and 15–25% of value; C items are the remaining 50% of SKUs and only around 5% of value. Those percentages are conventions to anchor a first pass, not targets to force your data into. If your top 5% of SKUs already carry 80% of value, your A class is smaller and tighter than the textbook — and that is fine, because the boundaries exist to serve your operation, not the other way around.
The metric that drives the ranking is annual consumption value, not unit price. A $2 component used 40,000 times a year (an $80,000 annual value) outranks a $900 part sold twice ($1,800). Ranking by consumption value is what surfaces the items that quietly dominate your spend, which a price-sorted list would bury.
How to run ABC analysis in five steps
Step 1 — calculate annual consumption value for every SKU. The formula is plain arithmetic: annual consumption value = annual units used × unit cost. Use a trailing 12 months of movement so seasonal peaks and troughs average out; a single month can badly misrepresent a seasonal item.
Step 2 — rank every SKU from highest annual consumption value to lowest. This single sorted list is the backbone of the whole exercise; everything after it is drawing lines on that list.
Step 3 — add each SKU’s share of total value and a running cumulative total. Divide each SKU’s consumption value by the grand total to get its percentage, then accumulate down the ranked list so you can see where the cumulative curve crosses 80% and 95%.
Step 4 — draw the class boundaries. A items are the SKUs from the top of the list down to roughly 80% cumulative value; B items are the next band up to about 95%; C items are everything below. These thresholds are conventions you can tune — a critical-parts business might pull the A line in tighter, a high-mix distributor might widen B — but keep them consistent so the classes stay comparable over time.
Step 5 — label each item with its class and attach a policy to the label. The class letter is only useful once it changes what you do: how often you count the item, how tightly you review its reorder point, and who is allowed to adjust it. A class with no policy behind it is just a tag.
Worked example: ABC analysis on 500 SKUs
A distributor stocks 500 SKUs worth $975,000 in combined annual dollar usage. Ranking every SKU from highest to lowest annual usage value, the top 100 SKUs — 20% of the catalog — account for $780,000 of that total, exactly 80%. Those 100 become A items and get counted monthly.
The next 150 SKUs (30% of the catalog) add up to $146,250, about 15% of total value, and become B items, counted quarterly. The remaining 250 SKUs (50% of the catalog) account for just $48,750, roughly 5% of value, and become C items, counted once a year. The distributor now spends most of its counting hours on the 20% of SKUs that represent 80% of what’s actually at stake.
Read the result as a workload plan, not just a chart. Before the exercise, all 500 SKUs competed for the same attention; after it, the team knows exactly which 100 items justify a monthly count and manager review, and which 250 can safely wait a year. The same $48,750 tail that would swamp a count-everything schedule now costs a single annual pass.
How to act on each class
The classification drives how often each tier gets attention: A items are typically counted and reviewed monthly, B items quarterly, and C items annually. The same tiers can also set reorder-point review frequency, purchase-approval requirements, and how tightly a location is controlled — an A item might need a manager’s sign-off to adjust, where a C item doesn’t. A items also earn the closest supplier management and the most deliberate safety-stock math, because a stockout there is the one that hurts.
C items deserve the opposite treatment: keep the controls light on purpose. A simple two-bin or min/max reorder, a bulk buy, and an annual count are usually enough. Applying A-grade rigor to C items “to be safe” quietly erases the entire benefit of the exercise, which is spending less effort on the items that barely matter.
Revenue alone can misclassify a critical item, so factor in operational risk, not just dollars. A $4 bolt that stops an entire production line if it runs out deserves A-tier attention even though its dollar value looks like a C item. Lead time and supply risk belong in the judgment too: a slow-moving part from an unreliable single-source supplier can warrant closer watching than its consumption value alone would suggest. Many teams run a plain value-based ABC first, then hand-promote a short list of business-critical parts up a class.
Common mistakes with ABC analysis
The first mistake is classifying purely by revenue and ignoring operational risk. A low-cost part that halts production or blocks a customer’s repair deserves A-tier treatment regardless of its dollar value — value ranking is the starting point, not the final word.
The second is running the classification once and never rerunning it. New products launch, old ones decline, and demand shifts with the season, so an item’s tier should move with its actual usage. A class list that is a year stale is quietly steering your counts and reorders with last year’s priorities. Rerunning the ranking quarterly, or at least twice a year, keeps it honest.
The third is applying the same count frequency to every tier “to be safe,” which erases the whole point of the exercise. If C items get counted as often as A items, you have simply added a labelling step to a count-everything routine. The fourth, related mistake is classifying using only sales history without accounting for lead time or supply risk — the class list should reflect how hard an item is to replace, not just how much of it you sold.
How to run ABC analysis in StockZip
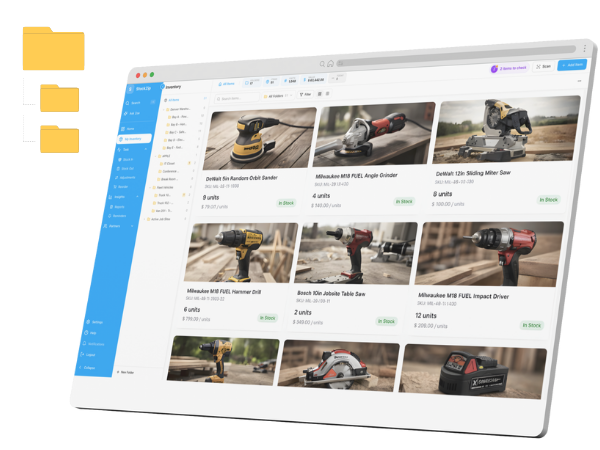
StockZip doesn’t run ABC classification automatically, but the pieces are there to build one and keep it current. Item-level tags or custom fields can hold an A, B, or C label, and folders or categories can group stock so the classes are easy to see and filter. Once each item carries its class, the stock count task can be filtered to that tag, so A items get counted on a tighter schedule than C items without maintaining a separate workflow for each tier.
To rank items in the first place, a paid plan’s inventory valuation and movement reports give you the annual consumption value per item that the ranking depends on — quantity moved against unit cost — instead of exporting to a spreadsheet. (Reporting is a paid feature; the Free plan does not include reports.) Low-stock alerts and per-item minimum levels then let you enforce the policy your classes imply: set tighter minimums and earlier alerts on A items, looser ones on C items, so the software nudges you toward the replenishment cadence each class deserves.
The honest summary: StockZip won’t compute your ABC classes for you, but it will hold the labels, group the stock, feed the counts and valuations you rank from, and let you count and reorder each class on its own schedule — which is most of the operational payoff of ABC analysis once the first ranking is done.