

Scanning a barcode with a phone
Scan with your phone

Count, move, and find stock with the camera already in your pocket. Works offline, syncs later.

Try the live demo →
Organized stock on shelves
Switching from Sortly?

Bring folders, photos, and history over in an afternoon — with pricing that stays predictable at renewal.

See pricing →
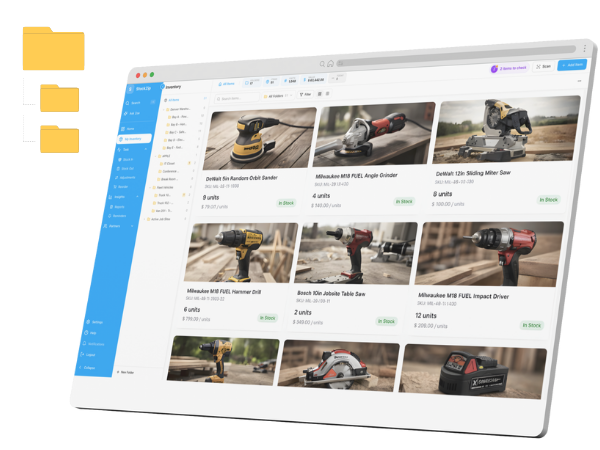
Folder-style inventory list
Free spreadsheet templates

Excel, Google Sheets, and printable count sheets — ready to download, no signup needed.

Get the templates →
Free tool

Safety stock calculator

Calculate the buffer inventory that protects you from demand spikes and late deliveries — and see the reorder point it produces. No signup, runs in your browser.

Start freeRead the safety stock guide

Free for 100 items · no credit card

Calculate your safety stock

Safety stock = (max daily usage × max lead time) − (average daily usage × average lead time)

Busiest realistic day

Typical day, from sales history

Worst delivery you have seen

Typical order-to-delivery time

Safety stock

160 units

Buffer against spikes and delays

Resulting reorder point

300 units

(20 × 7 lead-time demand) + 160 safety stock

Interpretation: Hold 160 units as a buffer. If demand spikes to 30 units/day while a delivery runs 10 days, this buffer covers the gap that your average-based planning (20 units/day, 7-day lead time) would miss.

The safety stock formula

Safety Stock = (maximum daily usage × maximum lead time) − (average daily usage × average lead time). The first term is your worst realistic case; the second is what your reorder point already plans for. Safety stock is exactly the gap between the two.

The max scenario is the busiest sales day you actually see, combined with the slowest delivery a supplier has actually made — use real history, not hypothetical disasters. The average scenario is your normal day and normal lead time.

This max-minus-average method gets most small businesses to a sensible number without a statistics course. If you have clean daily sales history and want a tighter answer, the statistical Z-score version (Safety Stock = Z × σLT) is covered in the FAQ below and in the full guide.

A worked example

Say you normally sell 20 units a day with a 7-day lead time, but your worst realistic day is 30 units and your slowest delivery took 10 days. Max scenario: 30 × 10 = 300 units. Average scenario: 20 × 7 = 140 units.

Safety stock is 300 − 140 = 160 units. That buffer covers the gap between planning on averages and living through worst cases. The resulting reorder point is the average lead-time demand plus safety stock: 140 + 160 = 300 units.

How safety stock feeds the reorder point

Safety stock is one ingredient of the reorder point: Reorder Point = (average daily usage × average lead time) + safety stock. The first term covers expected demand while you wait for a delivery; safety stock covers the unexpected. This calculator shows the resulting reorder point automatically.

Not every item needs a buffer. Prioritize A-items — the roughly 20% of items driving 80% of your sales, or the ones whose stockout stops a job — and give cheap, slow-moving, or easily substituted C-items little or none. Review levels quarterly and after any supplier or demand change.

Frequently asked questions

How do I calculate safety stock?
The most practical formula for small businesses is: Safety Stock = (maximum daily usage × maximum lead time) − (average daily usage × average lead time). For example, if you normally sell 20 units a day with a 7-day lead time, but your worst realistic day is 30 units and your worst delivery took 10 days: (30 × 10) − (20 × 7) = 300 − 140 = 160 units of safety stock. It covers the gap between planning on averages and living through worst cases.
What is the safety stock formula with Z-score?
The statistical version is: Safety Stock = Z × σLT, where Z is the service-level factor (1.65 for 95%, 2.05 for 98%) and σLT is the standard deviation of demand over the lead time. It gives a tighter answer when you have clean daily sales history, but it requires calculating standard deviations per item. The max-minus-average method on this page gets most small businesses to a sensible number without a statistics course.
How much safety stock is too much?
If safety stock regularly exceeds what you sell during an entire lead time, you are probably over-buffered — that inventory costs money to hold and can become dead stock. Watch two signals: items whose stock never comes close to the safety level (reduce it), and items that still hit stockouts (increase it or fix the supplier). Review levels quarterly and after any supplier or demand change.
Do I need safety stock for every item?
No. Prioritize A-items — the roughly 20% of items driving 80% of your sales or the ones whose stockout stops a job — and give C-items little or none. Slow-moving, cheap, or easily substituted items often need no buffer at all; a stockout there is an inconvenience, not a crisis. An ABC analysis tells you which items deserve the buffer.
How does safety stock relate to the reorder point?
Safety stock is one ingredient of the reorder point: Reorder Point = (average daily usage × average lead time) + safety stock. The first term covers expected demand while you wait for a delivery; safety stock covers the unexpected. This calculator shows the resulting reorder point automatically, and our reorder point calculator works the same formula from the other direction.
Is this safety stock calculator free?
Yes — free, no signup, runs in your browser. StockZip publishes it because setting the number is step one; step two is having software watch it. In StockZip you set the reorder point (including your safety stock) per item, and low-stock alerts fire the moment stock crosses it — free for 100 items.

Related tools

All tools →

Automate reorder alerts with StockZip

Set a reorder point per SKU and StockZip alerts you the moment stock drops below it — no spreadsheets, no manual checks. Free for 100 items, no credit card.

Start freeSee low-stock alerts
Free for 100 items
No credit card
Start free