

Inventory planning: a practical guide for small business
Inventory planning is the set of decisions that determine which SKUs you stock, how many units of each, and when you reorder. It sits between forecasting (what you think you’ll sell) and execution (cutting POs). This guide walks the loop with real numbers — including the safety-stock formula most small businesses avoid because it looks scary. It isn’t.
What is inventory planning?
Inventory planning is the set of decisions that determine which SKUs you stock, how many units of each you keep on hand, and when you reorder. It sits between forecasting — what you think you’ll sell — and execution — cutting purchase orders and receiving stock. Skip it and you’ll either tie up cash in stuff that won’t move, or stock out on the items that pay your rent.
A working inventory plan answers four questions for every SKU you carry: Do we keep stocking this at all? How much should be on hand at any given time? At what level do we trigger a reorder (the reorder point)? And how much do we buy when we reorder? Notice what is not on that list — gut feel, "we always get 100 of these," or "the supplier said to bump it." Those are inputs to the plan, not the plan itself.
The mistake most small businesses make is conflating planning with purchasing. Purchasing is the act of cutting a PO. Planning is the policy that tells purchasing what to cut and when. Without the policy, every PO becomes a one-off judgment call — and judgment calls don’t scale past about 50 SKUs before you start making expensive ones.
Inventory planning vs. demand forecasting
People use these terms interchangeably and they shouldn’t, because the two have different inputs, different owners, and different cadences. Demand forecasting asks: what will customers buy? It looks at sales history, promotions, seasonality, and external signals — weather, the school calendar, a competitor closing — and outputs a unit forecast per SKU per week or month. The owner is whoever knows the customer best, usually sales or the owner.
Inventory planning asks the next question: given that forecast, what should we actually stock? It takes the forecast as a given and overlays supply-side reality — supplier lead times, minimum order quantities, case-pack sizes, cash on hand, and shelf space — and outputs a stocking policy per SKU. The owner is whoever buys.
Here is why mixing them gets expensive. If your forecast says "we’ll sell 50 a week" and your supplier’s MOQ is 500 with an 8-week lead time, both are true facts — and together they imply a totally different stocking strategy than the forecast alone suggests. Run demand and inventory planning as separate steps, then combine them. Forecasting is the input; planning is the decision.
The 4-step inventory planning process
Treat planning as a repeating cycle, not a one-time setup. Step 1 — Analyze. Pull the last 90 days to 12 months of sales by SKU: units sold, revenue, gross margin, current on-hand. Sort by revenue and give your top 20% most of your attention. While you’re there, flag anything turning less than twice a year as a discontinue-or-markdown candidate. Bad data here breaks every later step.
Step 2 — Forecast. Project demand for the next 4–12 weeks. For most small businesses a 3-month moving average is good enough; layer in a seasonal index if you have seasonality. Be honest about uncertainty — a forecast is a hypothesis, not a fact. Step 3 — Set policy. For each active SKU, pick a reorder point, a reorder quantity (EOQ or the supplier MOQ, whichever is higher), and a safety stock level. The output is a single row per SKU: "when on-hand drops to X, order Y units."
Step 4 — Execute and review. Cut POs against the policy — then, the step everyone skips, review last cycle. Did anything stock out? Did anything sit too long? Adjust the policy, not just the next PO. That last step is what separates a plan from a wish. If you never look back, you’re not planning; you’re improvising on a clipboard.
Safety stock: the planning math
Safety stock is the buffer you carry to absorb the difference between forecast and reality, and it is where the planning math earns its keep. The standard formula is: Safety stock = Z × σ × √L, where Z is the service-level factor, σ is the standard deviation of demand during one lead-time period, and L is the lead time measured in those same periods.
Work it through for a real SKU. Say you sell branded coffee mugs and 12 weeks of sales average 23.3 units a week with a standard deviation (σ) of about 3.6 units, and your supplier’s lead time is 4 weeks (L = 4). Pick a service level: 90% uses Z = 1.28, 95% uses Z = 1.65, 99% uses Z = 2.33. Go with 95% for a normal SKU and plug in: Safety stock = 1.65 × 3.6 × √4 = 1.65 × 3.6 × 2 ≈ 12 units.
Then fold it into the reorder point: (average demand during lead time) + safety stock = (23.3 × 4) + 12 ≈ 105 units. So you reorder when on-hand hits 105. If your supplier becomes unreliable and lead time itself starts to vary, a more advanced formula adds the variance of lead time too — but for most small businesses this version gets you 80% of the benefit with 20% of the headache.
Inventory planning tools (and the ones you don’t need)
Match the tool to where you are, not where you wish you were. A spreadsheet (Excel or Google Sheets) works fine up to roughly 200 SKUs and one location: you’ll need a sales export, a table with formulas, and the discipline to refresh weekly. It’s the cheapest, most flexible, and most fragile option — and it breaks predictably. The spreadsheet stops being enough the moment you cross any one of these: more than ~200 active SKUs, more than one location, more than one person touching stock, or barcode-driven receiving.
Past that breakpoint, light inventory software earns its keep. You get a single source of truth, reorder alerts, and the reorder and order-quantity math built in, so the plan lives next to the stock instead of in a file someone forgets to refresh. Monthly cost is usually less than a single stockout on a top-20 SKU.
A full ERP (NetSuite, Acumatica, SAP Business One) only makes sense with multi-entity accounting, complex manufacturing, or 1,000+ SKUs and deep supplier integrations — they are powerful and expensive in both license fees and setup time. And skip the shiny middle entirely: standalone forecasting tools and "AI-powered" demand-sensing for sub-1,000-SKU catalogs solve a problem you don’t have yet. If a vendor can’t answer "what does it actually compute?", you don’t have to buy it.
Common inventory planning mistakes
Ordered by how often they bite: first, planning the average and ignoring variance. If demand swings 30% week to week, planning for the mean stocks you out half the time — safety stock exists precisely for this. Second, treating every SKU the same. Your top 20 SKUs deserve weekly attention; your bottom 50% deserve a quarterly review and possibly the chop.
Third, ignoring lead-time changes. Suppliers slip and shipping lanes shift; if you didn’t update your lead time after the last delay, your reorder point is already wrong. Fourth, no review step — setting a plan and never checking whether it worked is the single most expensive mistake here, because it lets the same error repeat every cycle.
Fifth, buying to MOQ on slow movers. If the supplier’s minimum is 500 and you sell 5 a month, that’s an eight-year supply parked in cash and shelf space. Find a new supplier, accept the higher per-unit price on smaller orders, or stop carrying the SKU. Most of these are obvious in hindsight — the review step in the cycle is where you catch them before they cost you another quarter.
Inventory planning in StockZip
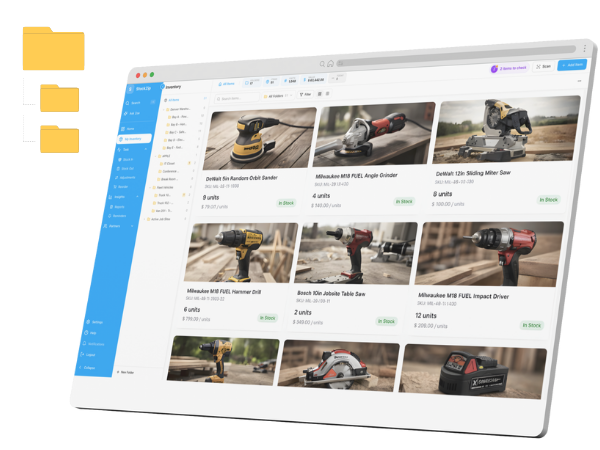
StockZip won’t write your plan, but it removes the spreadsheet fragility that makes planning fall apart past ~200 SKUs. Barcode scanning keeps on-hand quantities accurate as stock moves, per-item minimum levels store the reorder point your policy sets, and low-stock alerts fire when on-hand crosses it — so the "when on-hand drops to X, order Y" row from step 3 becomes an automatic nudge instead of a manual check. Scanning, per-item minimums, and low-stock alerts are all on the Free plan.
For the Analyze step, the sales, movement, and inventory-valuation reports give you units sold, margin, and turnover per SKU without exporting to a spreadsheet — the raw material for ranking your top 20% and spotting dead stock. Reporting is a paid feature (Starter and up); the Free plan does not include reports, so on Free you’d run the analysis from a CSV export instead.
The honest summary: StockZip holds the accurate counts, minimums, and alerts that execute a plan, and — on a paid plan — the reports that feed the analyze-and-review ends of the loop. The forecasting and policy decisions are still yours; the software’s job is to make sure the numbers you plan from are real and the triggers you set actually fire.